Find out more about NDIS reforms
Minister Shorten is hosting a series of NDIS Community Catch Ups in May to answer your questions
Continue reading Find out more about NDIS reforms
Minister Shorten is hosting a series of NDIS Community Catch Ups in May to answer your questions
Continue reading Find out more about NDIS reforms

Potential scam alert relating to the SEDI.
Continue reading SEDI Scam Alert
Expressions of Interest are now open for the Chair and CEO of the National Disability Research Partnership
Continue reading National Disability Research Partnership seeking Chair and CEO
The Reconnect Review is an important opportunity to assess the appropriateness, effectiveness and efficiency of the program.
Continue reading Review of the Reconnect Program
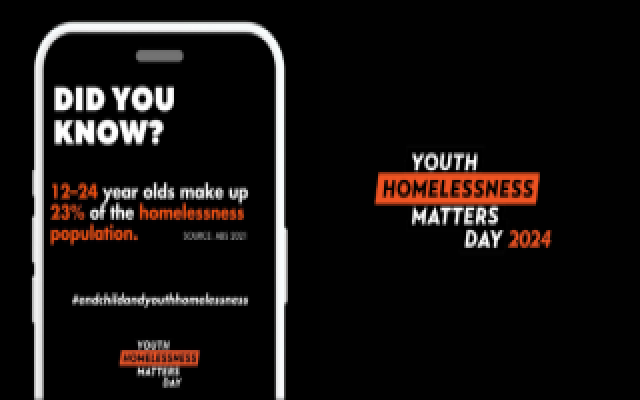
Today is Youth Homelessness Matters Day
Continue reading Recognising Youth Homelessness Matters Day 2024
Australians in need of family, domestic and sexual violence support now have an additional avenue for receiving assistance, with the official launch today of a new, on-demand video counselling service through 1800RESPECT.
Continue reading 1800RESPECT is increasing its options for victim-survivors seeking support

Search the DSS Grants Service Directory
DSS grants are now advertised on the Community Grants Hub website.

Opening soon

Opening soon
Closing date: 31 May 2024

Closing date: 14 June 2024
Closing date: 13 May 2024
Closing date: 25 May 2024
Closing date: 17 May 2024